
- Interactive computing, all in the browser
- A notebook consists of markup, code and results
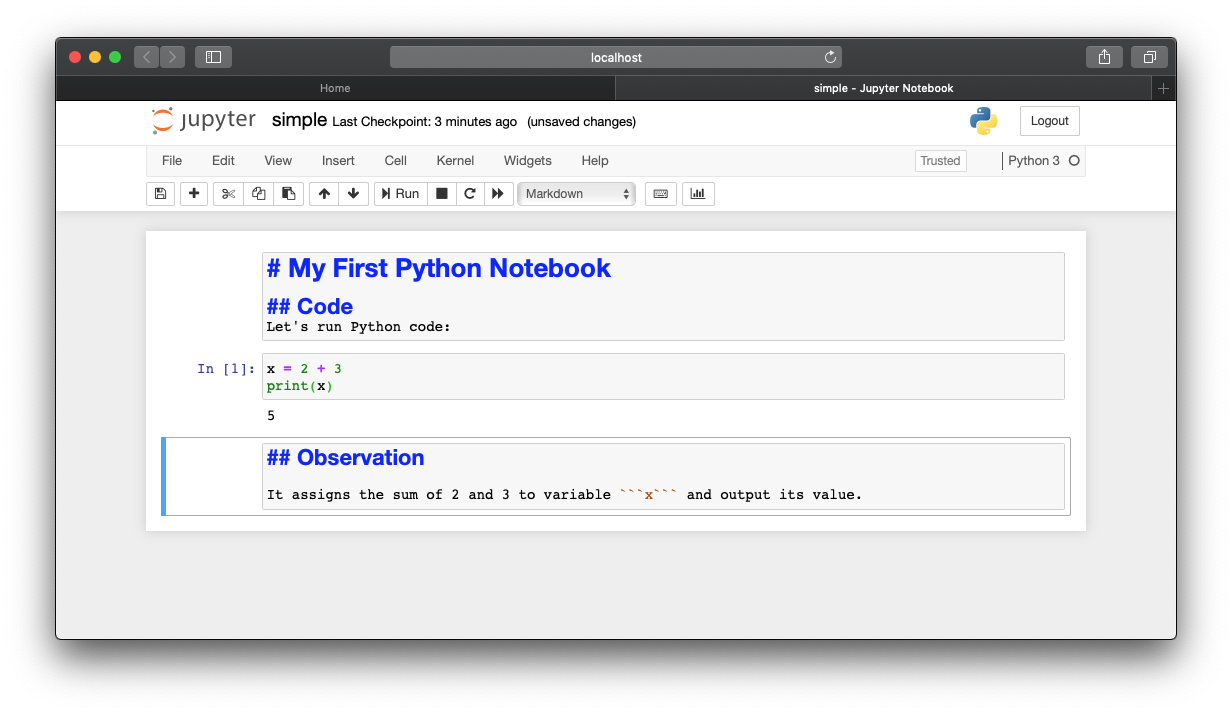
The Jupyter Notebook is a tool for interactive computing. It provides a web interface so you can code, write, compute, and analyze, all in the browser. The notebook thus generated can be structured to include markup (descriptions), code (algorithm), and results of the computuation (data and analytics).
While Jupyter Notebook supports different languages, our focus is on Python 3.

- Notebook: a sequence of cells
- Major types of cells:
- Code Cell
- Markdown Cell
The basic element of a notebook is a cell. Notebook is essentially a number of cells arranged in a particular ordered. There are two major types of cells: the code cell where you can program and execute, and the markdown cell where you write and structure your report content.
Operations:
- Menu bar to insert, run, merge, delete cells, etc.
- Toolbar has buttons for quick access to related menu items
- Most efficient is Keyboard Shortcut, for example:
Shift, EnterorCtrl, Enter(two keys) to run the current cellShift, Ctrl, - (minus)(three keys) to split a cell at the cursorShift, Mto merge selected cellsAto insert a new cell aboveBto insert a new cell below
To find out about more shortcuts:
- Go to menu Help > Keyboard Shortcuts, or
- Simply press H (in the command mode).

Working with keyboard shortcuts, it is important to differentiate the two modes.
Most of the shortcuts works in the Command mode. For example,
In Command mode, press:
Mto change the cell to Markdown;Yto change the cell to Code.
What happen if you press M and Y in the Edit mode? You simply type M and Y into the cell.
So if you typing in the cell and want to change the type, first press Esc to enter the command mode, and then hit M or Y to make the change.
Code Cell
A code cell is where:
- You develop Python code
- Everything should be in the Python syntax
A code cell can be run:
- Using a kernel in the back:
- Output will be shown after the cell
- Text output, e.g. from a
printstatement - HTML output, e.g. a HTML table from the
pandaspackage - Visualization and figures, e.g. from
matplotlib
- Text output, e.g. from a
For example, press Shift, Enter in the following code cell on a notebook:
print("Hello, world!")
It will produce the text output Hello, world!
%matplotlib inline
import matplotlib.pyplot as plt
plt.plot([[0,0],[1,1]], "b--", linewidth=3, label="line")
plt.show()
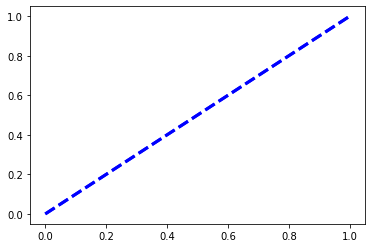
It will run the code and produce the figure that follows.
Markdown Quick References
Headers
markdown
# H1
## H2
### H3
#### H4
##### H5
###### H6
Ordered Lists
markdown
1. First item
2. Second item
3. Third item
Unordered Lists
markdown
+ Apple
+ Orange
+ Banana
Embedded Lists
markdown
+ John's TODO:
  1. Buy parts
  2. Fix car
  3. Clean garage
+ Groceries
  - Flour
  - Vegetables
  - Fruit
Links
markdown
[Search Engine](https://www.google.com)
Images
markdown
Code (verbatim)
print("Showing the code only!")
document.write("Hello again!");
Tables
markdown
|            | attribute 1 | attribute 2 | .. | attribute k |
|------------|-------------|-------------|----|-------------|
| object 1   |             |             |    |             |
| object 2   |             |             |    |             |
| ..         |             |             |    |             |
Blockquotes
markdown
Einstein:
> God does not play dice.
Horizontal Lines (Rules)
markdown
---
___
***
HTML
For more sophisticated formats, you can include HTML to, for example:
- Change the size and style of an image;
- Write text in different colors and fonts;
You may consult the following:
LaTeX
Here is an example of LaTeX (MathJax subset):

Magics are mechanisms to make it easier to perform certain tasks.
Try the following in a code cell:
%lsmagic
It shows all available magics in your Jupyter environment. There are two types of magics:
- Line magic, with
%, works on a single line of code; - Cell magic, with
%%, applies to the entire cell;
n = 10**6
sum(range(n))
The above code computes the sum of integers $1,2,..,10^6-1$. To time the computation:
%time sum(range(n))
Or you can time the whole cell:
%%time
n = 10**6
sum(range(n))
Earlier, we used %matplotlib inline to generate a figure in the notebook.
There are additionl options one can use with the %matplotlib magic.
For example:
%matplotlib notebook
import matplotlib.pyplot as plt
plt.plot([[0,0],[1,1]], "b--", linewidth=3, label="line")
plt.show()

This produces an interactive figure that you can zoom and resize.
There are many other magics such as those for debugging, logging, and automatic actions on the notebook. And I encourage you to explore on your own.

Jupyter Notebook is a simple yet very powerful tool. I hope it helps you better organize your data, code, and analysis.
References
- The Jupyter Notebook Documentation: https://jupyter-notebook.readthedocs.io/en/stable/notebook.html
- Markdown cheatsheet: https://github.com/adam-p/markdown-here/wiki/Markdown-Cheatsheet